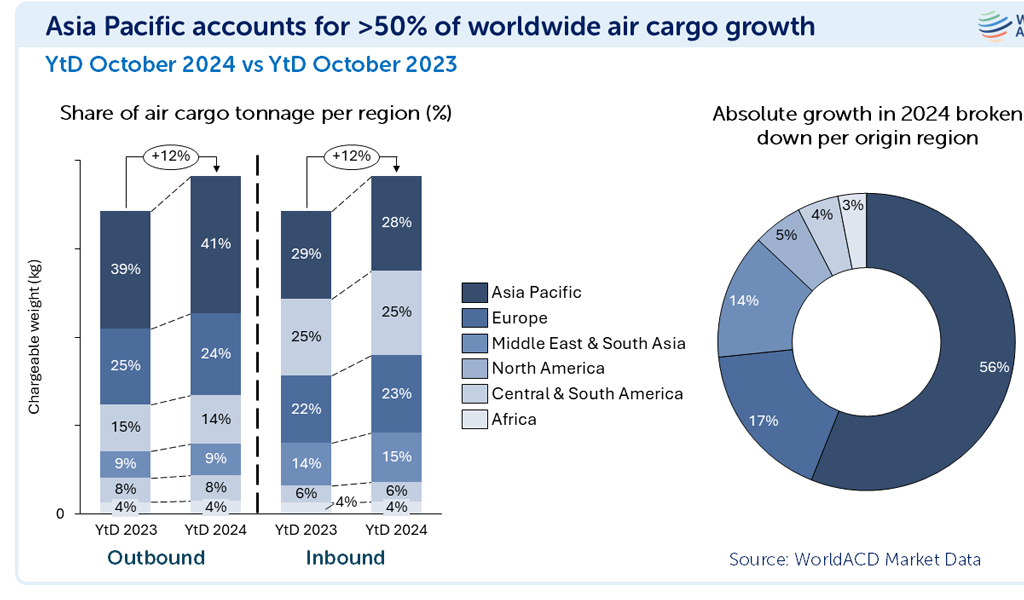
 WorldACD air cargo growth graph
Asia Pacific origin markets are continuing to contribute an outsize share of worldwide air cargo growth this year, generating more than half (56%) of the global +12% year-on-year (YoY) increase in tonnages in the first 10 months of 2024.
According to analysis by WorldACD Market Data, the region’s strong contribution this year means Asia Pacific’s share of worldwide outbound tonnages overall has risen two percentage points to 41% from 39% last year, well ahead of Europe on 24%, Central & South America on 14%, Middle East & South Asia (MESA) with 9% of global volumes, and North America’s 8% market share.
Meanwhile, Dubai topped the list of October’s top 5 inbound YoY growth markets, thanks to a +19% increase, closely followed by Frankfurt, New York, Singapore and Miami. For all five, that growth was led by general cargo, with special cargo making up around one quarter to one third of the growth – led by vulnerables/high-tech for all except New York, where temperature-controlled (predominantly pharma) shipments were the biggest special cargo import growth category.
Africa stable
Africa’s share of both outbound and inbound air cargo traffic remained stable at 4%, based on the more than 2 million monthly transactions covered by WorldACD’s database.
After origin Asia Pacific with its 56% share of global tonnage growth this year, Europe came in as the second origin region accounting for a much lower 17% of global tonnage growth. But the buoyant MESA region contributed 14% of outbound tonnage growth this year, despite its smaller 9% share of global volumes, bolstered by traffic shifting to air this year due to continuing disruptions to the region’s ocean freight markets.
Vulnerables/High-tech dominates special cargo growth
Within Asia Pacific’s 56% share of worldwide growth in the year to date (YtD) to the end of October, general cargo contributed almost two thirds (64%), boosted by large volumes of e-commerce traffic flying consolidated as general cargo, while special cargo generated 36%.
And that special cargo element was dominated by the vulnerables/high-tech product category, which made up around 80% of growth in special cargo.
Among the top 5 individual airport or city origin growth markets, the world’s busiest air cargo gateway Hong Kong also remained the biggest single generator of YoY outbound growth in October, as it has for much of this year.
Hong Kong’s +15% YoY tonnage increase generated around twice the growth in absolute chargeable weight of second-placed Miami, even though the latter had recorded +31% YoY growth compared with its tonnages in October last year. Dubai was the third-biggest outbound growth market, thanks to its +45% YoY increase in October, closely followed by Shanghai and Tokyo.
Special cargo drives Hong Kong outbound increase
For Hong Kong, all of that growth in October was generated by special cargo, predominantly vulnerables/high-tech, with general cargo recording a slight YoY fall in chargeable weight. Miami’s growth was a balance of general cargo and special cargo, whereas growth from Dubai, Shanghai and Tokyo came mainly from general cargo.
Meanwhile, the top 5 YoY decreases in inbound tonnages were recorded in Teheran, Beirut, Beijing, Dhaka and Zaragoza, with Teheran’s and Beirut’s inbound tonnages almost completely wiped out: tonnages at both airports were down by -96%, YoY, in October, as most commercial flights to and from Iran and Lebanon were suspended last month.
Dhaka, Beirut and Zaragoza – affected by political unrest, conflict, and flooding, respectively – also featured in the top 5 markets posting the biggest outbound decreases in October, followed by China’s Qingdao and Mexico’s Guadalajara.
October increases in rates, capacity and tonnages
According to analysis by WorldACD, worldwide chargeable weight flown in October rose by +8% compared with the previous month, and was +11% higher than in October last year. All six major global origin regions recorded month-on-month (MoM) and YoY increases in October, including double-digit percentage MoM increases in tonnages from Europe (+12%), Central & South America (CSA, +11%), North America (+10%), and Africa (+10%). And for the 10 months to the end of October, all six regions contributed YoY increases to the total chargeable weight growth of +12%, with Middle East & South Asia (MESA, +18%) and Asia-Pacific (+17%) recording the biggest YtD increases.
Capacity, meanwhile, rose by +2% in October compared with the previous month, and by +5%, YoY, on a YtD basis capacity increased by +6%. Average worldwide rates, meanwhile – based on a full market average of spot rates and contract rates – edged up by a further +1% in October compared with September, taking average prices +12% higher, YoY. The biggest YoY rates increases in October came from MESA (+49%) and Asia-Pacific (+17%), as has been the case for much of this year. There were notable MoM rates increases in October from CSA (+5%) Africa (+4%), Europe (+3%), and Asia-Pacific (+2%) origins.
Rates and tonnages consistently higher in 2024 since week 20
WorldACD’s figures indicate that worldwide total chargeable weight has been above last year’s levels for most of 2024, and since week 8 it has been consistently higher every single week. On the pricing side, average worldwide full market rates took likely longer to overtake last year’s levels, but since week 20 they have been consistently higher than the equivalent week last year. Averaged across the first 10 months of 2024, YtD average full-market worldwide rates are roughly the same as their equivalent levels last year.--TradeArabia News Service
